


Home / Glossary / What Is Customer Acquisition Cost
What Is Customer Acquisition Cost
What is customer acquisition cost? How to calculate it and compare it with lifetime value and payback, with a worked example and lead costs by industry.
The formula
Customer acquisition cost = sales and marketing costs / new customers acquired
Wikipedia's page on customer acquisition cost is the plain public definition of the same idea.
Use one period. A month is the usual operating view. A quarter is calmer if the sales cycle is long. That's often true for a law firm or a commercial paving bid.
Example
This is the example the rest of the page uses. It's built so the later chart lands on round figures. It isn't a client result or an industry average.
Sales and marketing in the period: $48,000. New customers: 100.
48,000 / 100 = $480
That $480 is the acquisition cost. It isn't the cost of a lead, and it isn't the cost of a click.
What is customer acquisition cost made of?
What you put in the cost is the whole decision. Two companies can both say "$480" and be counting different things. Pick a list and print it on the report.
Costs that usually belong in the number:
- Media spend for the campaigns meant to win new customers
- Agency or freelancer fees for that work
- Sales pay, commissions and the share of an owner's time spent selling new work
- The tools that capture and follow up on new demand, such as call tracking and the CRM
- Creative, landing pages and list costs tied to new-customer campaigns
Costs that usually don't belong:
- Delivery payroll for jobs you already sold
- Rent on the shop, unless you're building a fully loaded overhead rate on purpose
- Retention discounts for customers you already have
- One-time brand work you've decided to keep outside the monthly number
If you include sales salaries one quarter and drop them the next, the trend is fake. Fully loaded cost is the honest number for "can we afford this customer." Media-only cost is the honest number for "did the ads get more expensive." Label which one you're holding.
Marketing attribution is how you stop giving every new customer to whichever channel touched them last. If you can't tie a customer to a source, you can still compute a company-level cost. You can't yet compute a channel cost you should trust.
New customers and blended cost
New-customer cost uses only customers acquired in the period. Some reports divide the same spend by every customer who paid that month. That includes people who've bought for years. The result is a blended cost. It looks better, and it answers a different question.
Example, still the same $48,000. If 100 people are new and 300 older customers also paid, a blended figure is 48,000 / 400 = $120. The company didn't acquire those 300 people this period. The $120 number hides a $480 cost of winning someone new.
Use the new-customer figure when you set a budget. Use a blended figure only when you're describing the whole book of customers, and say so in the label.
A worked path from the $480
The chart later on this page assumes each of those customers contributes $120 of gross profit a month. Gross profit here means revenue minus the direct cost of doing the work. It isn't cash in the checking account before materials and labor.
Payback months = acquisition cost / monthly gross profit per customer
480 / 120 = 4
The customer covers the $480 in month 4. That's payback.
Year-1 gross profit = monthly gross profit × 12
120 × 12 = $1,440
Value-to-cost ratio = year-1 gross profit / acquisition cost
1,440 / 480 = 3.0
So this example pays back in 4 months and ends the year at 3.0 times cost. That holds if the $120 continues and the customer stays. If the customer buys twice and leaves, the ratio falls apart. The chart draws the steady case so you can see the crossing point.
Customer acquisition cost and lifetime value
Lifetime value is the gross profit you expect from the customer over the whole relationship, not only year 1. People mix three versions, and they aren't interchangeable.
Simple services version. Average gross profit per job, times jobs per year, times the years you actually keep that kind of customer.
Example, separate from the chart. A $2,000 job at a 50 percent gross margin is $1,000 of gross profit. Two jobs a year for three years is 1,000 × 2 × 3 = $6,000 of lifetime gross profit. If acquisition cost is $480, the ratio is 6,000 / 480 = 12.5. That's a different business from the chart's $120 a month. Don't paste one example onto the other.
Subscription version. A simplified take: average revenue per customer, times gross margin. Divide that by the share of customers you lose in the period.
Example. Revenue per customer is $200 a month. Gross margin is 60 percent. Monthly churn is 5 percent.
200 × 0.60 / 0.05 = $2,400
That $2,400 is a gross-profit lifetime value under those assumptions. Change the churn and the value swings hard. Five percent churn and two percent churn aren't the same company.
The ratio. Lifetime value divided by acquisition cost. In this example the year-1 figure is 3.0x. A longer lifetime can push the full ratio higher, if your retention supports it. Don't claim the longer number until you've counted the repeat work.
Keep both sides in gross profit, or both sides in revenue. A revenue lifetime over a fully loaded cost will look wonderful and mean little.
Payback, on one chart
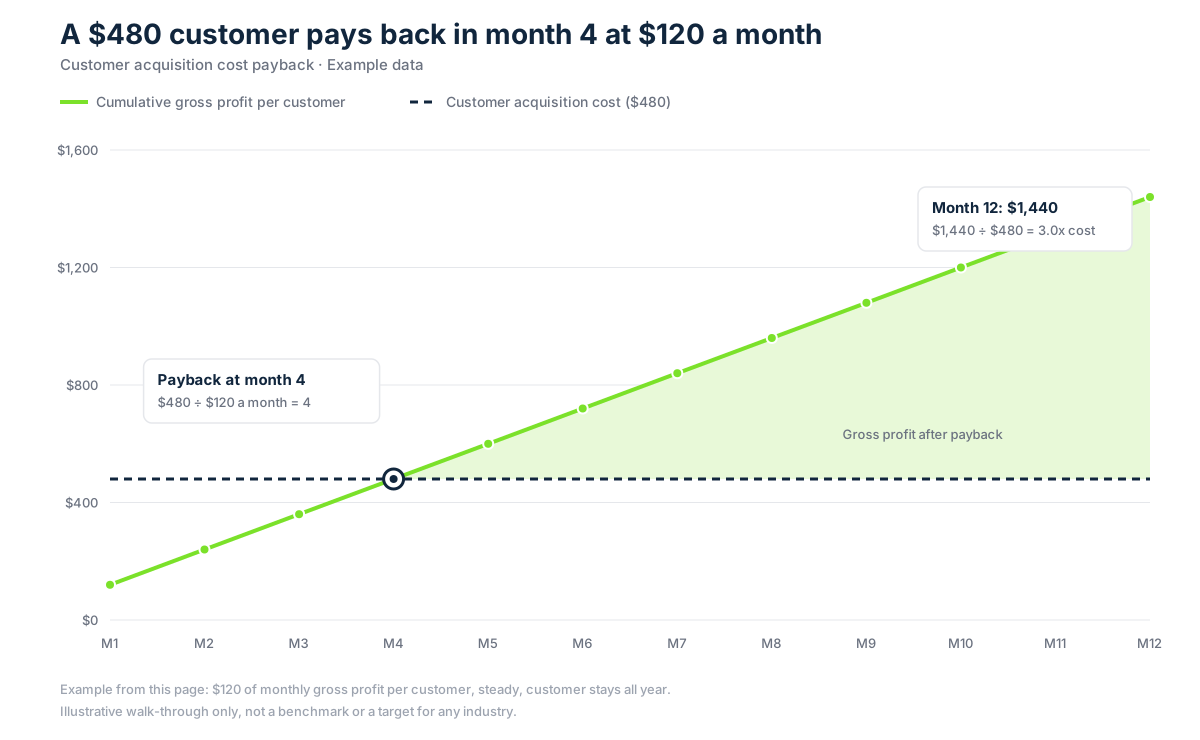
Payback answers a cash question the ratio doesn't. A strong ratio that takes four years to collect can still break a company. Payroll still comes due every Friday. Payback says when the gross profit catches the cost.
Read the flat line as the $480 you already spent. Read the rising line as gross profit added up month by month: $120, $240, $360, then $480 at month 4. After that, the shaded months are profit you haven't yet spent on the next customer. At month 12 the rising line is at $1,440.
The chart has no target band. Payback that suits one business can sink another. Some service businesses collect most of the gross profit on the first job. They can pay back in month 1 and still be healthy. Others discount the first job and earn the margin on a service agreement. They'll look more like the chart.
What is a good acquisition cost
A good cost is one the gross profit can repay before the cash runs out. It also holds a ratio you're willing to live with. Neither is a dollar cap, and no single ratio fits every trade.
Three checks, in order:
- Payback fits the cash you have. Say payback is 4 months and payroll is weekly. You still need cash to float those 4 months for every new customer.
- The ratio stays at or above the floor you chose, using the same profit definition on both sides.
- The jobs are ones you can staff. A cheap customer you can't schedule isn't a win.
Stage of the company matters. A business buying growth on a line of credit can accept a longer payback. A business that needs this month's jobs to make payroll can't. Write the constraint down. "We won't add a channel whose payback is longer than 6 months" is a decision. "We want a low CAC" isn't.
Cost per lead is not acquisition cost
Ad platforms report cost per lead, not cost per customer. A lead is a call or a form. A customer is someone who bought.
Turn a lead cost into a media-only customer cost with your close rate.
Media cost per customer = cost per lead / close rate
This one is only an illustration. Say leads cost $90 and 1 in 5 becomes a customer. Close rate is 20 percent, so media cost per customer is $450. Add sales time, call tracking and outside fees before you compare it with the $480 example. At a 10 percent close rate, the same lead costs $900 per customer in media alone. The ad price didn't change. The sales path did.
Fully loaded and media-only, side by side
Take the same 100 customers and show both definitions. This is still the example, not a study.
Media, outside fees and call tracking: $30,000. Sales pay and commissions for new-customer work: $18,000. Total: $48,000.
- Media-only cost = 30,000 / 100 = $300
- Fully loaded cost = 48,000 / 100 = $480
Both are true. A media buyer judged on the $300 figure may scale campaigns too far. Once sales time is in the math, the company can't afford them. An owner who only watches the $480 figure may kill an efficient campaign. The real issue there might be sales capacity. Put both numbers on the page, and decide in advance which one sets the budget.
If the owner is the salesperson, price the hours. Suppose 100 new customers took 200 hours of the owner's selling time. You don't need a salary study to see the shape of it. Pick the hourly figure you'd pay someone else to do that work, multiply and add it. Leaving the hours at zero makes every channel look cheaper than it is.
Acquisition cost by channel
Company-level cost is the number for the board. Channel cost is the number for the weekly spend meeting. Build it only where you can assign both the spend and the customers.
Columns that belong on one sheet:
- Channel
- Spend you're willing to assign to that channel
- New customers you can tie to that channel
- Cost per customer for that channel
- Gross profit per customer, if it differs by channel
- Payback using that channel's cost
Don't force a customer into two channels and then add the channel costs back up. The total ends up higher than the company cost. If attribution is shared, show a company line and a "credited" line, and say which rule you used. Last touch gives the last ad the customer. First touch gives the first ad the customer. Either is usable. A mix you can't explain isn't.
A channel with a high cost can still be the right one if its customers repeat. Another channel's customers might buy once. That's the lifetime side of the sheet, and it has to be measured, not assumed. If you don't have repeat data by channel, leave lifetime blank. Decide on first-job gross profit and payback instead.
Cohort cost and this month's invoices
A cohort is the group of customers you acquired in a period. Their acquisition cost is fixed when you spend the money. Their gross profit arrives over later months. The chart is a cohort view. The $480 is spent up front, and the $120 arrives each month after that.
A snapshot view divides this month's sales and marketing cost by this month's new customers. It's the right view for "what did a new customer cost us lately." It's the wrong view for "has the January cohort paid back." January's customers may still be producing gross profit in June. June's spend has nothing to do with that payback.
Pick one view for the trend line. Use the cohort view when you talk about payback and the ratio. Use the snapshot view when you ask whether ads and sales got more expensive this month.
A second example, with a longer sale
Law, accounting and some commercial construction don't close in a week. A quarterly formula is calmer.
Example, separate from the $480 chart. In a quarter the practice spends $90,000 on marketing and business development and opens 30 new matters.
90,000 / 30 = $3,000
Say the average matter produces $9,000 of gross profit, and most of it arrives within the quarter. The first-matter ratio is 9,000 / 3,000 = 3.0, and payback lands inside the quarter. You wouldn't draw the software-style 12-month line and scold the practice for missing a monthly curve. You'd ask whether the $9,000 shows up in collected gross profit or only in a proposal.
Write the cycle time next to the cost. A $3,000 cost on a $9,000 matter that takes nine months to collect is a cash problem. That's true even when the ratio is 3.0.
How a service business should read this
This page is written for owner-led service businesses and professional practices. Think HVAC, plumbing, paving, automotive, law and accounting. Owners in those trades are too busy to guess at marketing, and they rarely have a full in-house team. Multi-location companies use the same math when growth is fast and teams aren't watching one number.
For those businesses, acquisition cost has to include the person who answers the phone. A $90 lead that rings for four hours and then calls the next shop wasn't cheap. Speed to the first response sits inside the cost. So do a clear offer and a calendar that can take the job. They count even when they never appear on the ad invoice.
Lead generation is the work of producing the demand. This page is the work of pricing it. Return on ad spend tells you whether the ads returned revenue. Acquisition cost tells you whether the customer paid off after the other costs.
How to bring the cost down
The detailed pass is how to reduce customer acquisition cost. The levers, in the order they usually pay:
- Fix the definition before you change the budget. If sales pay is missing, you don't know the cost yet.
- Raise the close rate. The same cost per lead is a very different customer cost at 10 percent and at 30 percent.
- Answer faster and route the call to someone who can book the job. Slow follow-up burns leads you already paid for.
- Cut queries, audiences and hours that spend money without becoming customers. Do this after tracking works.
- Match the offer to work you can deliver at the margin you used in the payback math. A cheap customer with no margin doesn't improve the ratio.
- Keep customers longer when the work repeats. Retention doesn't lower the cost of the next customer. It raises lifetime value, the other half of the ratio.
Then recompute. If payback got shorter because you dropped sales salaries from the formula, you didn't improve anything.
Common mistakes
- Calling cost per lead the acquisition cost. The industry chart is a lead chart.
- Dividing by all customers, including ones you've had for years, and calling it the cost to acquire.
- Putting revenue on the lifetime side and fully loaded cost on the acquisition side.
- Using a software 12-month payback rule as a law for a contractor who collects on the first invoice.
- Changing what "sales and marketing" includes so the trend looks better.
- Ignoring owner time. If you're the salesperson, your hours are a cost.
- Celebrating a low cost on customers you can't schedule, or on work that breaks even after materials.
- Comparing this month's ads with a lifetime value you haven't measured. If you don't know repeat rate, stop the lifetime math at the first job and say so.
The cost per lead calculator helps when you have spend and leads but no customer count yet. Want a second set of eyes on the definition, the payback and your capacity? Use the assessment at the bottom of the page.
Common questions
How is customer acquisition cost calculated?
Divide sales and marketing cost for the period by the number of new customers acquired in that period. If the company spent $48,000 and gained 100 new customers, acquisition cost is $480. Write down which costs you included, and use the same list every month.
What is a customer acquisition cost example?
In the example on this page, sales and marketing cost $48,000 and the company adds 100 customers. Cost is $480 each. Each customer contributes $120 of gross profit a month, so payback is 4 months. Over 12 months, gross profit is $1,440. The ratio of that value to the $480 cost is 3.0. Those figures are an example, not a client result.
What is a good LTV to CAC ratio?
There's no single number for every business. Many owners want lifetime gross profit at several times the cost to win a customer. The right bar depends on your margin and how fast the cash comes back. Build both sides from gross profit.
What is CAC payback period?
Payback is how many months of gross profit it takes to recover the cost of winning a customer. Divide acquisition cost by monthly gross profit per customer. At $480 and $120 a month, payback is 4 months. A business paid on the first job can live with a shorter clock.
What is a good cost per customer acquisition?
A good cost is one the customer's gross profit can repay on a schedule you can fund. There's no single dollar figure for every trade. Cost per lead is a different number, so divide it by your close rate and add non-media costs.
Should acquisition cost include the owner's sales time?
Yes, in the fully loaded number. Put a fair hourly value on the time you spend quoting and closing.