


Home / Glossary / What Is ROAS
What Is ROAS
What is ROAS, how the formula works, and when a return on ad spend is actually good for a services company. Includes a worked example and a monthly chart.
How to calculate ROAS
The ROAS formula is simple.
ROAS = revenue from ads / ad spend
You can write the answer three ways. They're the same number.
- As a multiple. 6.0x means six dollars of revenue per dollar of spend.
- As a ratio. 6 to 1.
- As a percent. 600 percent. Some reports do this. It's easy to misread, so say which form you're using.
Example
These figures are example data, not a client result. In one month the company spent $12,000 on ads. It recorded $72,000 of revenue from those ads.
72,000 / 12,000 = 6.0
That month is a 6.0x ROAS. The chart below uses the same July figures.
Count only revenue you can tie to the ads. For a plumber or a law firm, that's usually booked jobs or signed matters. They should trace back to a tracked call, form or visit. Don't drop all company revenue into the numerator. Organic sales, referrals and repeat work will make the ads look better than they were.
What belongs in ad spend
Platform spend is the invoice from the ad network. Fully loaded spend adds the rest of what it took to run the ads.
Include platform spend every time. Then decide, in writing, whether these also count.
- Agency or freelancer fees for the account
- Creative, landing pages and call tracking
- The share of a salesperson's time that exists only because the ads are on
- Discounts you gave to win the job
If you change the definition mid-year, the chart will lie. Pick one definition and keep it on the report.
What is ROAS in a real month?
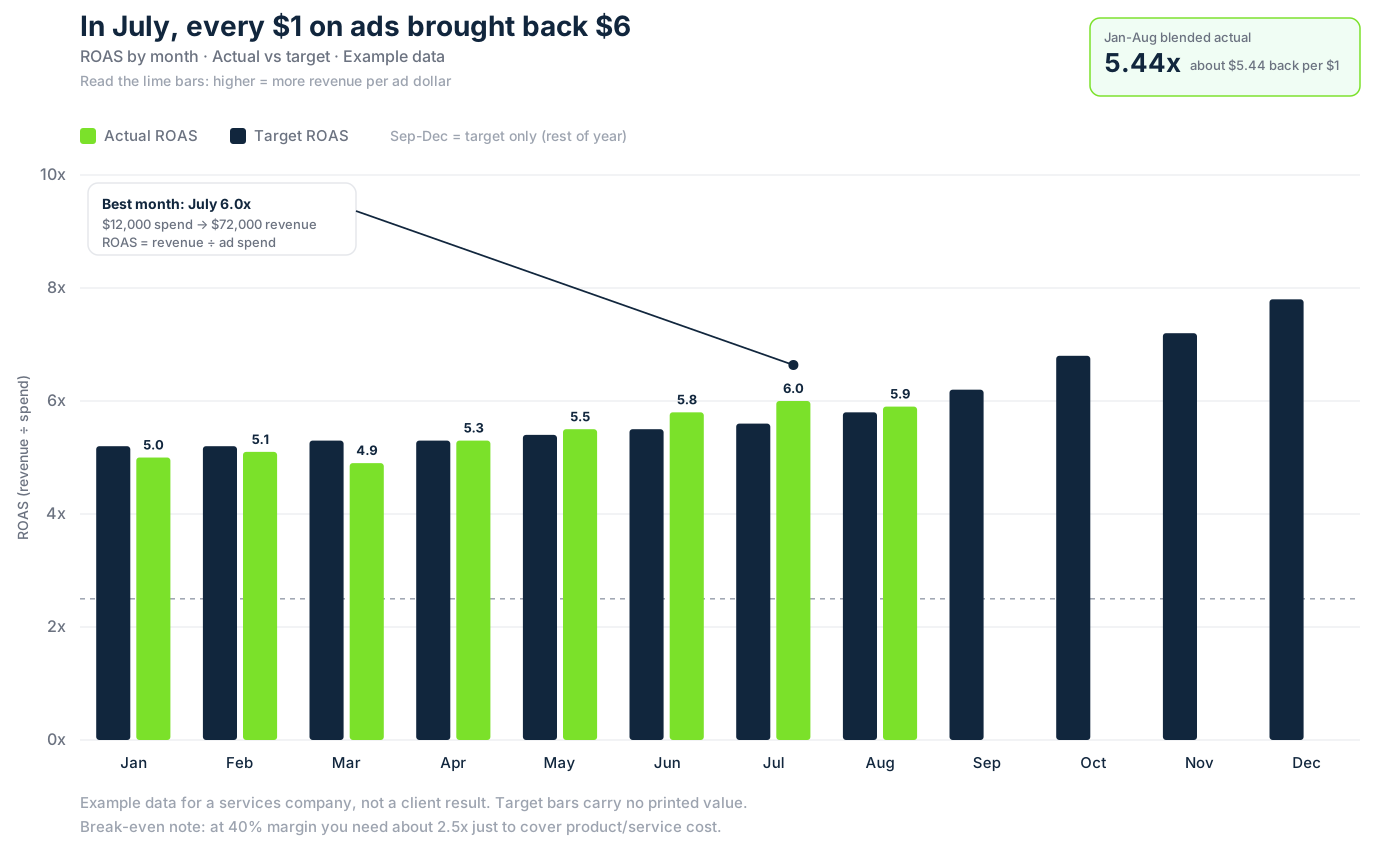
The figure compares actual ROAS with a target, month by month. Lime bars are actual. Navy bars are the target. September through December show a target only, since those months are still ahead in this example.
Read the chart from left to right. Actual stays near the target through spring, then runs ahead in June, July and August. July is the high month. The blended actual for January through August is about 5.44x, or about $5.44 of revenue per $1 of spend. The later months are targets only. Don't treat a target bar as a result.
What is a good ROAS
A good ROAS clears break-even and still leaves gross profit. The break-even identity is:
Break-even ROAS = 1 / gross margin
Gross margin here means what's left after the direct cost of doing the job, divided by the revenue. If margin is 40 percent, break-even is 1 / 0.40 = 2.5x. You need $2.50 of revenue per $1 of ads just to cover delivery. Overhead, owner pay and the next ad invoice are still unpaid.
Change the margin and the bar moves.
| Gross margin | Break-even ROAS |
|---|---|
| 25 percent | 4.0x |
| 40 percent | 2.5x |
| 50 percent | 2.0x |
| 60 percent | about 1.67x |
There's no single published ROAS that fits a plumber, a law firm and a shop with the same margin. Use the break-even line for your own margin. Then ask whether the leftover gross profit pays overhead. Customer acquisition cost is the next question. A strong ROAS on cheap leads is useless if those leads never become customers you can afford.
ROAS and ROI are not the same
ROAS stops at revenue over ad spend. Return on investment keeps going until you're looking at profit.
A simple way to see ROI on the same ads:
Profit from the ads = revenue from the ads, minus the cost of delivering that work, minus the ad spend
ROI = that profit / ad spend
Use the July example. Revenue is $72,000. Spend is $12,000. Suppose the direct cost of doing the work is 60 percent of revenue, so $43,200. Profit after delivery cost and ad spend is 72,000 minus 43,200 minus 12,000, which is $16,800. ROI is 16,800 / 12,000, or 1.4x. The ROAS was 6.0x. Both numbers are true. They answer different questions.
Google's help page on return on investment walks through profit as well as revenue. Read it beside your own margin. Don't paste their example into your board report.
What the months on the chart say
The bars are labeled. These are the actual ROAS figures printed on the chart, and they're example data.
| Month | Actual ROAS on the chart |
|---|---|
| January | 5.0x |
| February | 5.1x |
| March | 4.9x |
| April | 5.3x |
| May | 5.5x |
| June | 5.8x |
| July | 6.0x |
| August | 5.9x |
September through December show a target bar only. The chart doesn't print a target number on those bars, so this page doesn't invent one. The only dollar pair given is July: $12,000 of spend and $72,000 of revenue.
If you average the eight labeled months you get 5.4375, which rounds to the 5.44x blend on the chart. A dollar-weighted blend can differ if some months spent more than others. The chart gives spend for July only. So don't treat 5.44x as proof that every month spent the same amount.
ROAS in the ad account and ROAS in the books
The ad platform will show a ROAS if you send it a conversion value. That number uses the rules inside the account. Those rules cover which conversions count, the value you attached and the attribution window. The books use invoices.
They match only when three things are true.
- The conversion value is the revenue you'll actually collect, not a placeholder like $1 per form.
- The date window is the same. A job sold in July and invoiced in August lands in different months, depending on which system you trust.
- You're looking at the same campaigns. Don't blend brand search, paid social and remarketing, then compare the blend with one of them alone.
Write the rule on the report. "ROAS on this page is invoiced work from paid clicks, divided by platform spend. Work counts in the month the invoice is sent." Then keep it.
ROAS, CPA, and customer acquisition cost
ROAS doesn't name the cost of a lead or a customer. You need a second number for that.
Cost per acquisition from ads = ad spend / customers from those ads
July again, still example data. Spend is $12,000 and revenue is $72,000. Suppose the average job is $1,200. The chart doesn't include that assumption. We added it so the steps are visible. Customer count is 72,000 / 1,200 = 60. Ad cost per customer is 12,000 / 60 = $200.
If those 60 customers came from 240 leads, cost per lead is 12,000 / 240 = $50. The close rate is 60 / 240 = 25 percent. Change the close rate and both the lead cost and the customer cost move. The ROAS stays 6.0x until revenue or spend changes.
Fully loaded customer acquisition cost adds sales pay, tools and outside fees on top of the media. That's a different denominator problem, covered on the customer acquisition cost page. Use ROAS to judge the ads. Use acquisition cost to judge whether a new customer is affordable.
ROAS by channel
Compute the same formula for each channel, with the same revenue rule and the same spend rule. A channel that counts view-through revenue will beat one that counts only booked jobs. That happens even when the booked jobs are the real ones.
A useful one-page comparison has four columns: channel, spend, tracked revenue and ROAS. Add the break-even line as a note below the columns. Don't drop a channel just because its ROAS is the lowest. It may be the one that starts the jobs the others close. Say which attribution you used. Last click gives the last ad the credit. First click gives the first ad the credit. Either can be right if you label it.
Common mistakes
- Mixing all revenue into the numerator. Referrals and repeat work aren't an ad result unless you can show the path.
- Changing what "spend" means from one month to the next.
- Comparing a percent ROAS in one report with a multiple in another.
- Calling 4 to 1 a goal without a margin.
- Judging a channel on last-click ROAS when the first touch was somewhere else. Say which attribution you use.
- Killing a channel that feeds the sales team because its own ROAS looks soft.
- Treating September's target bar as if the month already happened.
How to improve ROAS
Improve the ratio by raising tracked revenue, lowering wasted spend or both. Do it in this order.
- Fix tracking before you change bids. If calls and forms aren't tied to campaigns, the ratio is a guess.
- Cut queries, audiences and hours that spend money and don't book work.
- Match the ad and the landing page to the job you actually want. A broad ad that wins the wrong jobs will look busy and pay poorly.
- Raise close rate and price before you raise the budget. More spend on a weak offer usually lowers ROAS.
- Recalculate break-even when wages or materials move. A 2.5x line drawn in January can be wrong by June.
The ongoing bid and budget changes live in PPC management. The marketing ROI calculator is the quick way to put profit next to the ratio.
Then look at the month again. If actual is above target and above break-even, you can test more spend. If the platform ROAS looks fine but you're below break-even, the problem is margin. More media won't fix it.
If you want a person to do it with you, book the free assessment at the bottom of this page.
Common questions
How is ROAS calculated?
Divide the revenue that came from the ads by the ad spend. A $12,000 spend that produced $72,000 of revenue is 72,000 divided by 12,000, which is 6.0. You can say 6 to 1, 6.0x or 600 percent. Use the same revenue definition and the same spend definition every month.
What is a good ROAS?
A good ROAS clears your break-even and leaves enough gross profit to pay the rest of the business. Break-even ROAS is 1 divided by gross margin. At a 40 percent margin, break-even is 2.5x. That 40 percent is an example, not an industry average. People often start the conversation at 4 to 1. Don't copy it as a target.
Is 2.5 ROAS good?
Only if your gross margin is above 40 percent. At a 40 percent margin, 2.5x is break-even on the cost of delivering the work. You haven't yet paid overhead, the owner or the next month of ads. If your margin is 60 percent, break-even is about 1.67x, and 2.5x leaves room.
Is 1.5 ROAS good?
For most services companies, no. A 1.5x return means $1.50 back for each $1 of ad spend. Unless the gross margin is above about 67 percent, that return doesn't cover the cost of doing the job. Check the margin before you celebrate a low ratio.
What is the difference between ROAS and ROI?
ROAS looks at revenue from ads divided by ad spend. ROI looks at profit after the cost of delivering the work, and often after other operating costs. It divides that profit by the money you put in. A high ROAS can still be a weak ROI if the jobs are expensive to fulfill.
Can ROAS be below 1?
Yes. Below 1 means the ads brought in less revenue than they cost in that period.
Should ROAS use revenue or gross profit?
ROAS uses revenue by definition. Use gross profit when you want ROI or a break-even check.
Why is my ad platform's ROAS higher than my books show?
Platforms often count conversions their own way and may claim the same sale twice. Your books count each sale once.
How long a period should I use for ROAS?
Long enough to include the sales your ads start. A short window undercounts jobs that close weeks later.